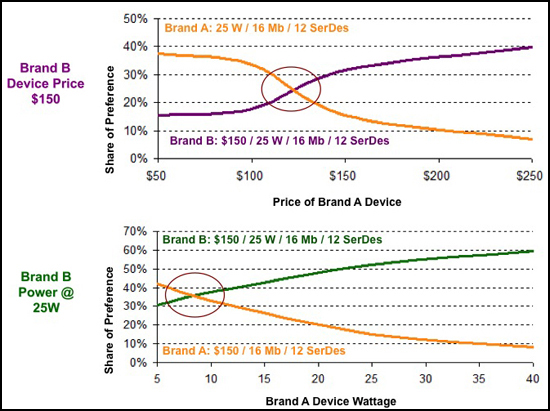
CBC also can be used for sensitivity analysis. For example, these charts show the trade-off of price and power dissipation.
As the first graph illustrates, for Brand A to compete with Brand B on price, Brand A needs to offer at a lower price point – approximately 120. Since Brand B is currently being offered at 150, dropping Brand A's price by 30 would take approximately 25% share of preference away from Brand B.
When we look at the trade-off of power and price, the results showed that the Brand A device would need to be offered with less than 10W to compete with Brand B's 25W device. If Brand A was offered with power at 5W, it would take about 10% share of preference away from Brand B.