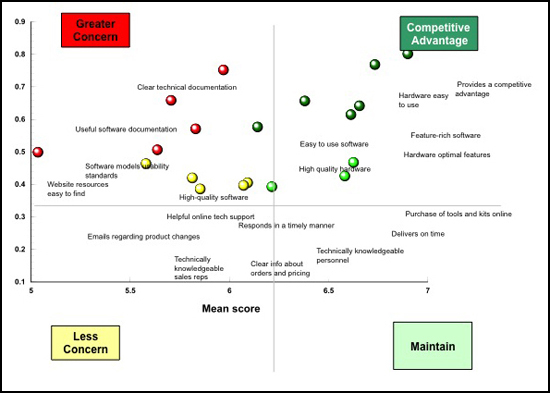
This chart from a company's customer loyalty study shows the relationship between company performance ("x" coordinate) across a range of performance attributes, and the importance of these same attributes (the "y" coordinate, derived using leverage analysis). The map demonstrates both the importance and value of each performance attribute.